Compile Report
On This Page
Compile Report
When you compile your model with csrun_cpu, for example:
csrun_cpu python run.py --mode=train --compile_only
the compiler writes out an estimated performance for your neural network into a text file. These estimates are generated immediately after the network is compiled and before the network is run on CS system.
These performance estimates provide you with valuable insights into how your network might perform on the CS system, without actually running it on the CS system.
See also
Compile on CPU for the documentation on csrun_cpu.
The performance estimates will appear in the file compile_report.txt in the directory where you compiled. See the following example output:
Estimated Overall Performance

 Samples/s:                    2321.9
 Compute Samples/s:            2321.9
 Transmission Samples/s:       2430.7
 Active PEs:                   93%
 Compute Utilization:          80%
 +-------------------------------------------------------------------------------------------+----------------+-------------------+------------------------+------------+---------------------+
 | Kernel Name                                                                               | Samples/s      | Compute Samples/s | Transmission Samples/s | Active PEs | Compute Utilization |
 +-------------------------------------------------------------------------------------------+----------------+-------------------+------------------------+------------+---------------------+
 |                                                                                           |                |                   |                        |            |                     |
 | fc_para42.fc                                                                              |         2321.9 |            2321.9 |                14311.7 |       5203 |                100% |
 | fc_para30.fc.lib_fc                                                                       |         2321.9 |            2321.9 |                14311.7 |       5301 |                100% |
Interpreting performance estimates
First, some background:
Idealized CS system utilization map
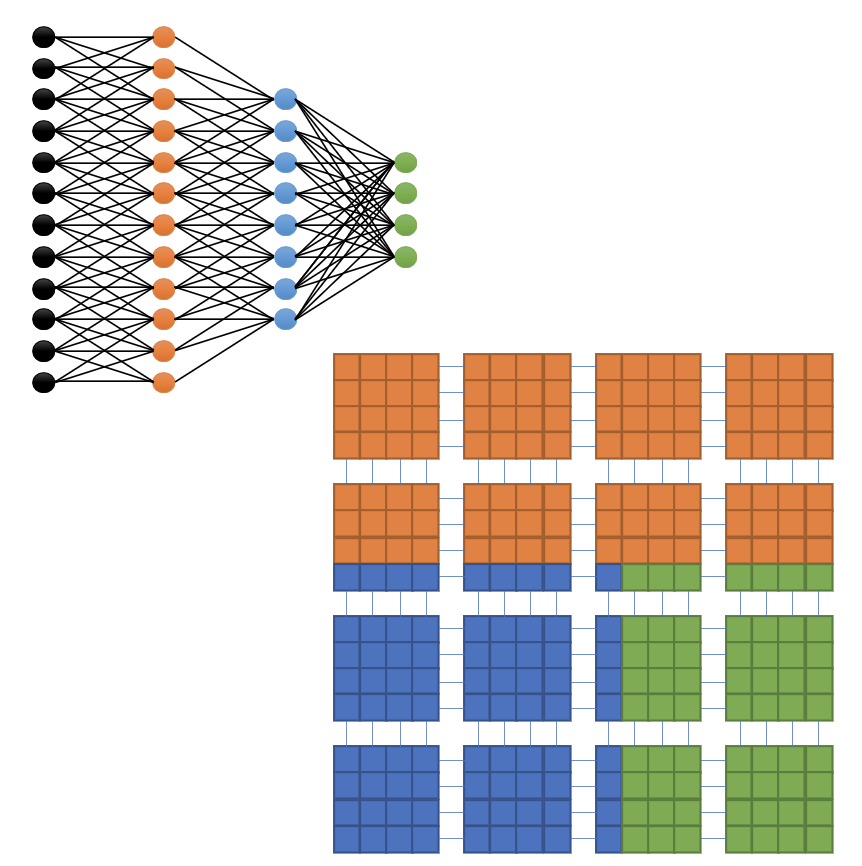
When a neural network is compiled successfully, the result is a bitstream that contains a mapping from the neural network operations in the code to the processing elements (PEs) on the CS system. See the following idealized conceptual diagram:

Fig. 5 Idealized CS system Wafer Utilization Map
In the above idealized scenario, each layer in the neural network is mapped to a rectangular area on the CS system containing a set of PEs. The orange, blue and the green layers in the neural network are packed compactly on the wafer so that:
No PE in a given rectangular area is left unused.
The entire wafer is fully utilized. That is, the three colored rectangles fully occupy the entire wafer.
Performance parameters
The bitstream represents the compiled version of the network. This bitstream contains the mapped rectangles of the CS system fabric. These mapped rectangles are called kernels.
Mapped kernels contain parameters that reveal the estimated performance of the network on the CS system fabric. In the layer-pipelined execution model of the CS system, the kernels are executed in a pipelined manner. Hence, how fast, or slow, a given kernel in the pipeline executes is one important measure of the performance of the entire network.
Samples per second
The samples per second, i.e., sample rate, is calculated directly from the sample delta-T. However, computing the delta-T requires completion of the placement and routing process. It is based on the specific details of the selected kernel versions and routing choices. Hence, instead of delta-T, a corresponding estimated sample rate is provided in the compile report. See the section Delta-T for a conceptual overview of delta-T.
This measure is a theoretical sample rate for the entire model, and is the lower of the two values: Compute Samples/s and Transmission Samples/s. See below.
Compute samples per second
Theoretical sample rate calculated based on the kernel computational overhead of the model. See Compute delta-T.
Transmission samples per second
Theoretical sample rate calculated based on the transmission overhead between the kernels for the model. See Transmission delta-T.
Active PEs
The percentage of processing elements (PEs) used by the model (compute + transmission). In other words, active PEs percentage is the percentage of PEs across the entire CS system fabric that have kernel code running on them.
Compute utilization
Percentage of processing elements used for compute only. Active PEs, though they have kernel code running on them, can be idle for some time. The compute utilization is the percentage of time these active PEs are running the kernel code.
Kernel statistics
The above measures are also reported for every kernel used by the model.
Delta-T
During the runtime, as the network undergoes training, it matters greatly how rapidly the successive input data can be streamed into a kernel. For the CS system, the duration of time required by the kernel between accepting two successive input batches is called delta-T, expressed in cycles.
See the following diagram that shows a simplified view of the various performance measures of a network:

Fig. 6 Conceptual View of Delta-T Parameters
Compute delta-T
The compute delta-T is the number of cycles a kernel consumes to perform a complete kernel computation on a single input batch.
Transmission delta-T
The result from a compute operation is stored in memory, and the transmission delta-T is the cycles the kernel consumes to communicate this result to the next kernel in the sequence.
A kernel can receive the input data, send the computed data, and compute with the already arrived data, either sequentially or all at the same time, depending on how the kernel is written. As a result, the following applies:
Delta-T for a kernel is equal to:
max(compute delta-T, transmission delta-T), if the kernel is able to transmit and compute at the same time, and
sum(compute delta-T, transmission delta-T), if a kernel is forced to serialize the operations of compute and transmit.
Note
Normally transmit and compute operations can be performed at the same time.